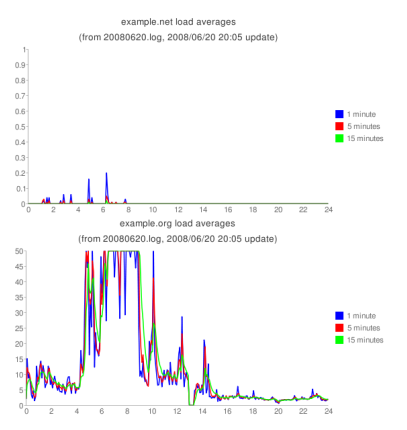
utgraph.py is a python script, it visualizes server's load averages
from simple uptime result lines log file. And this script is a my
study for pygooglechart and
Google Chart API.
Note: If you really need to use this script, I'll have to tell you a my opinion. Change your server. Porbably, it's better way than using this.

You can download from http://wids.net/archive/utgraph/, and extract tar.gz.
usage: utgraph.py [options] file

options:
  --version             show program's version number and exit
  -h, --help            show this help message and exit
  -d DIR, --directory=DIR
                        output DIR [default: ./]
  -t HOSTNAME, --target-host=HOSTNAME
                        target hostname (for title)
Typical case's configuration is here:
$ crontab -l
*/5 * * * * sh /home/ys/bin/monitor.sh
$ cat bin/monitor.sh
/usr/local/bin/wget -q http://wids.net/tmp/uptime.cgi -O - \
              >> /home/ys/monitor/wids.net/`date +%Y%m%d`.log
/usr/local/bin/python /home/ys/monitor/utgraph.py \
              -t wids.net \
              -d /home/ys/public_html/monitor/ \
                 /home/ys/monitor/wids.net/`date +%Y%m%d`.log
And utgraph supports these uptime formats:
   7:40PM  up 8 days, 23:51, 2 users, load averages: 0.01, 0.01, 0.00
   7:45PM  up 8 days, 23:56, 2 users, load averages: 0.03, 0.01, 0.00
   7:50PM  up 9 days, 1 min, 2 users, load averages: 0.00, 0.00, 0.00

 or

  23:45:01 up 2 days, 13:36,  2 users,  load average: 2.46, 2.15, 2.02
  23:50:02 up 2 days, 13:41,  2 users,  load average: 2.70, 2.35, 2.12
  23:55:01 up 2 days, 13:46,  2 users,  load average: 2.25, 2.52, 2.26
In the version 0.5, utgraph needs load average lines that the first char is blank (' '), but of course you can easily edit utgraph's parser.
If you hope to view some hosts in one page, you may write simple html
file, includes these hosts cur.png links. The cur.png files are always
symbolic linked to newest image file when utgraph runs. After all, you
hope to monitor more than 2 hosts, you should use the -d option.
'Why'? Because, the pygooglechart is licensed under the GPLv3.
Q: Do you use this script?
A: Of course, Yes. Oh my Dreamhost!!